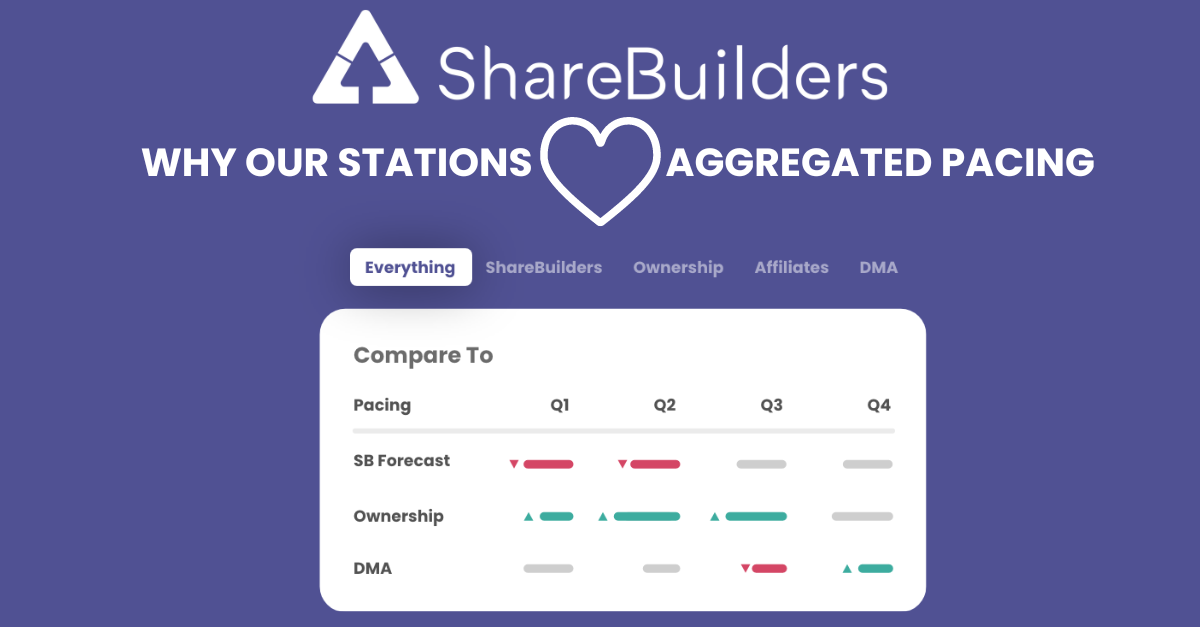
We’re told time and time again that one of our clients' favorite features in ShareBuilder Pricing is our aggregated pacing. And while the name doesn’t garner much excitement, the data behind it does.
What exactly is aggregated pacing?
Because we worked with over 300 TV stations, we have a good sample size to get the pulse of TV business nationwide. We take the pacing data - dollars on the books today vs. same day last year - of all those stations, breaking down local and national, and excluding political. It’s a straightforward way to see collectively how over 300 stations across the country are doing compared to last year. The data is refreshed daily.
We also break the pacing data into smaller but still sizeable categories, including network affiliation, region, and market size. It’s a quick way to recognize emerging trends. For example, the West region lagged behind other regions and the all-in pace for several quarters because of large non-returns affecting that specific area of the country. If you were a station on the West Coast and corporate was giving you a hard time about your diminished revenue, you could use ShareBuilders pace comparisons to prove that this was a trend for the region and not just your station.
.png?width=355&height=185&name=July%20Blog%20-Anita%20(3).png) Consultants review this data with stations on every call, making the data even more impactful. Our consultants usually have the color commentary for new or noticeable trends. Because they’re talking to so many different stations, they may have that explanation as to why CBS stations are pacing better than everyone else in September or why the top 20 markets are down more than other market sizes.
Consultants review this data with stations on every call, making the data even more impactful. Our consultants usually have the color commentary for new or noticeable trends. Because they’re talking to so many different stations, they may have that explanation as to why CBS stations are pacing better than everyone else in September or why the top 20 markets are down more than other market sizes.
This data can also be a source of pride or a wake-up call. Your station’s pacing data is also displayed, so you can easily see how you stack up against the rest of the country and the categories you belong to. Pacing ahead of everyone else? That’s cause for celebration! Pacing way behind everyone else? It might be time to review what’s down or non-returning from last year and make a game plan for replacing that lost revenue.
No other software in the industry can offer you this type of data, updated daily. You have to ask yourself, if so many stations trust ShareBuilders to help them with pricing and forecasting, why aren’t we doing it too?
.png?width=1001&height=107&name=ShareBuilders%20Logo%20(07052023).png)
