Greetings, fellow TV station moguls and advertising aficionados! Have you ever found yourself staring at a wall of Nielsen and Comscore data, scratching your head and muttering, "Ratings or impressions? Impressions or ratings? What's the deal with these things, anyway?" Fear not, my perplexed friends, for you are not alone in this comedic saga of advertising metrics.
Picture this: a befuddled TV station owner, dressed in a suit that may or may not have been last in fashion during the '80s, dramatically clutching a remote control like the sword Excalibur. The quest for the Holy Grail of TV advertising revenue is on, and the battle lines are drawn between the valiant Ratings and the swashbuckling Impressions.
Act I: The Ratings Roundtable
 In one corner, we have Ratings, the elder statesman of TV metrics. Armed with demographic data and the ability to tell you how many millennials watched your latest reality show about cats wearing sunglasses, Ratings is the seasoned warrior of the television battlefield. It's like having a secret decoder ring for the world of viewer preferences.
But beware, for Ratings can be as elusive as a cat during bath time. Sometimes, it's all about the percentage of the audience who watched, leaving you with questions like, "Did the other 80% just take a collective nap?"
Act II: The Impressions Implosion
On the other side of the ring, we have Impressions, the wild card of the advertising realm. Impressions are like the social butterflies of TV metrics, counting every flutter of eyelashes (or, in this case, every time someone sees your ad). It's the total exposure package, the influencer of the metrics world.
Yet, as our hero soon discovers, Impressions can be a bit like a teenager at a family reunion – there are a lot of them, and you're not entirely sure they're paying attention.
Act III: The Comedic Conundrum: Nielsen vs Comscore
Just when our intrepid TV station owner thought they had it all figured out, enter Nielsen and Comscore, the dynamic duo of measurement services. Nielsen, with its classic charm, has been the go-to for decades. But Comscore, with its modern flair and cross-platform capabilities, might just be the fresh face our hero needs.
Cue the laugh track as our protagonist navigates the hilarious maze of negotiations, trying to strike a deal that satisfies both advertisers and the station's bank account. It's a delicate dance, a tango of metrics, with ratings on one foot and impressions on the other.
Act IV: Utilize a data-driven approach powered by ShareBuilders
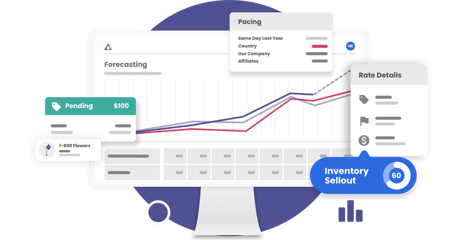
 Cast all this funny business aside for a moment and consider ShareBuilders to get you out of this mess. Our dual Holding Capacity model, inventory, and ratings analysis tools are unmatched in the industry to help stations meticulously evaluate their market standing relative to ratings. Using a data-driven tool such as ShareBuilders offers stations invaluable intelligence to determine which currency and ratings service provides the best opportunity to unlock your station's full potential.
Epilogue: The Bottom-Line Boogie
As our TV station owner wraps up their quest, they realize the key to maximizing advertising revenue isn't just about choosing between Ratings and Impressions. It's about embracing the chaos, finding the sweet spot that makes advertisers guffaw with delight, and reminding everyone that sometimes, the best strategy is a good ol' belly laugh and a data-driven approach to figuring this out.
So, my dear TV station comrades, fear not the ratings-impressions dilemma. Embrace the confusion, dance with the metrics, and remember: the funniest punchline of all is a bank account that's laughing all the way to the revenue bank. Keep those ads rolling, and may your ratings be high, your impressions higher, and your pockets fullest of all! Cheers to the wild and wacky world of TV advertising!
.png?width=1001&height=107&name=ShareBuilders%20Logo%20(07052023).png)
.jpeg?width=100&height=100&name=SDIM0897%20(Custom).jpeg)